How many users for which tickets?
In 2016, in a month of "full traffic" (not including school holidays), the volumes of users of the various transport tickets are as follows:
Published on
In 2016, in a month of "full traffic" (not including school holidays), the volumes of users of the various transport tickets are as follows:
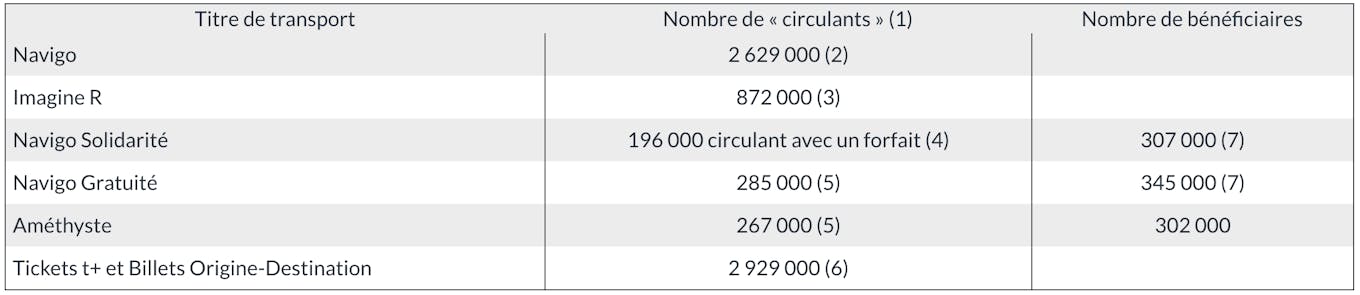
The volume of users of the different tickets over a month is a frozen photograph. The number of people who use a ticket at least occasionally is higher than what is observed over a month. For example, one person did not use Navigo in February but will do so in March, and another is in the opposite situation: for subscriptions, this irregular consumption behaviour can be the result of people working on a temporary basis or with variable places of work (consultants, craftsmen, etc.). This is especially the case for tickets and tickets used by very occasional travellers.
Thus, the number of Ile-de-France residents sometimes using a Navigo Monthly Pass or Week pass must be in the order of 1.5 to 2 million. And the number of Ile-de-France residents who sometimes travel with a ticket or a ticket is in the order of 5 to 6 million.
As the table below highlights, the public of ticket users is heterogeneous, mixing very regular passengers who consume nearly half of the tickets sold and occasional or even very occasional passengers. The public using Origin-Destination tickets is mainly an occasional audience.

Tickets are most commonly purchased in booklets, which is understandable by the multiplicity of possibilities of use since they are valid on the metro, the RER in Paris, the bus, and the tram. Suburban tickets, on the other hand, are mostly purchased individually: the use of booklet tickets mainly concerns people who use a route repeatedly.

In 2016, Navigo and Imagine R contributed 63% to revenues. Tickets and tickets, which are less subsidised than other tickets, account for just over a quarter of fare revenue.
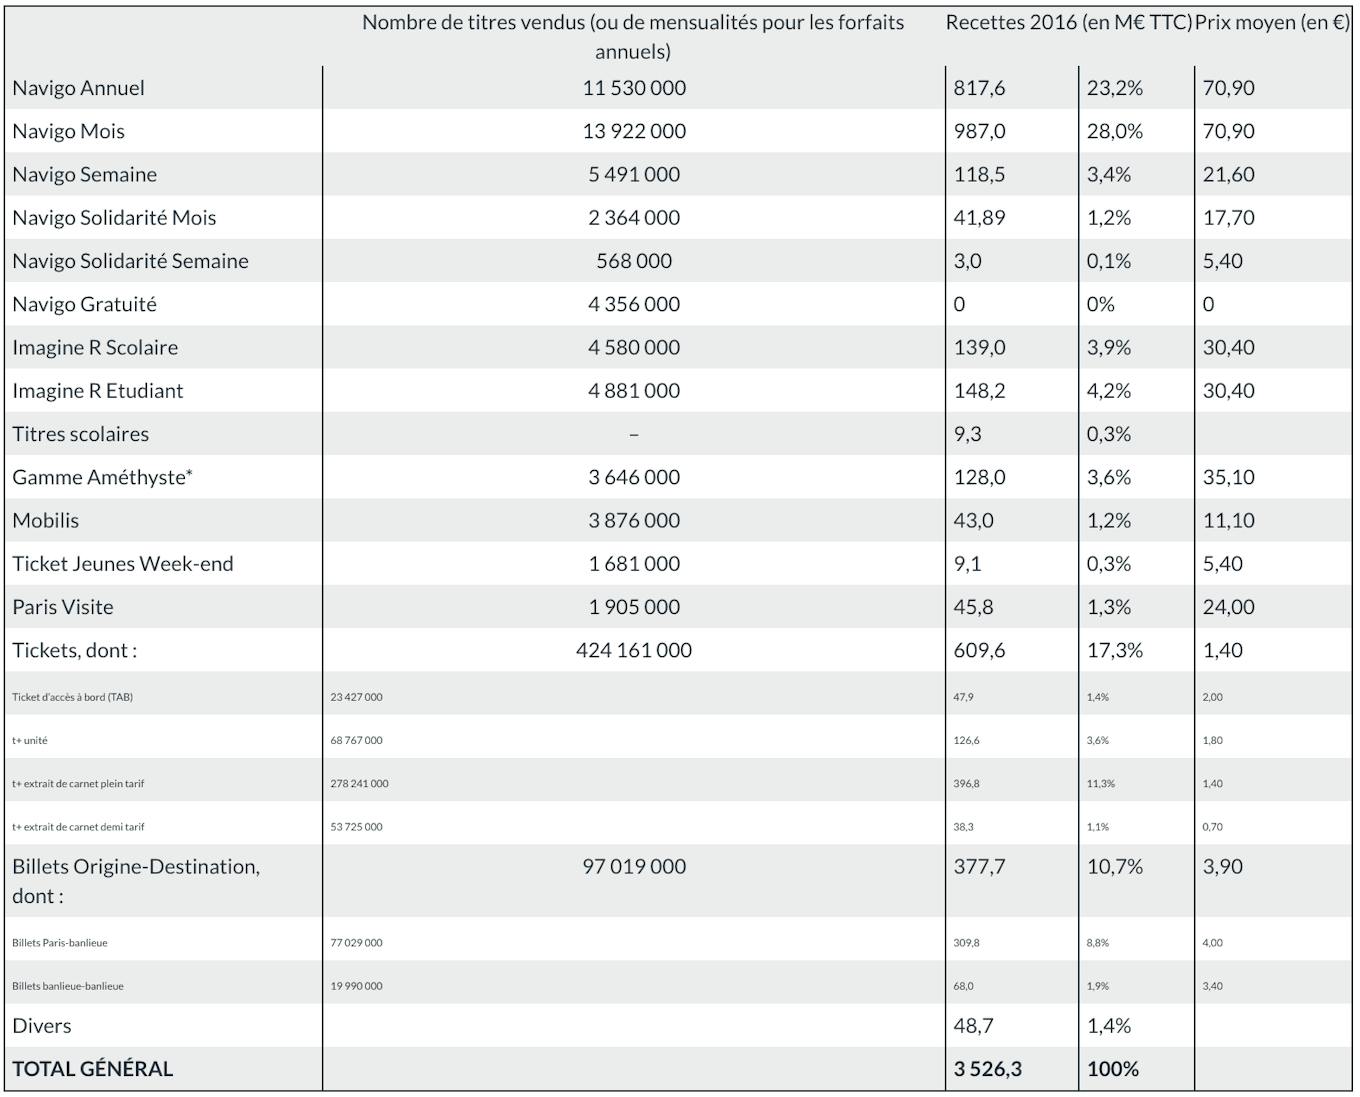
The table below shows the share of public transport traffic taken by each category of tickets in 2012. Navigo and Imagine R accounted for 2/3 of the traffic, tickets and tickets a little less than 20%.
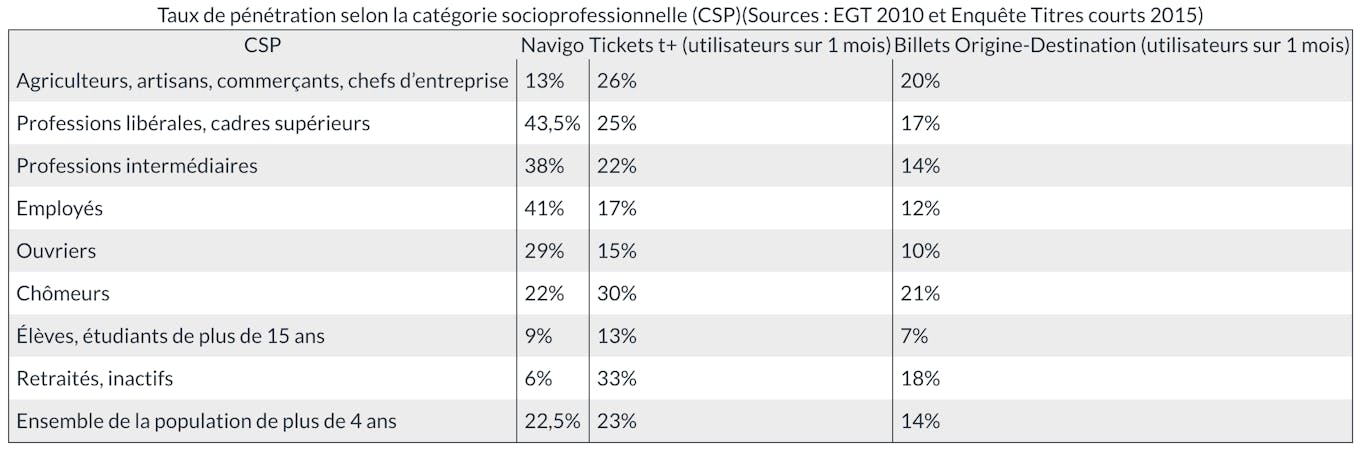
The penetration rate of a ticket in a population is the ratio between the number of users of this ticket belonging to this population and the total number of people in the population. For example, it should be understood, in the table below, that among Ile-de-France residents who are unemployed in a given month, 30% travel with a ticket at least once a month.
The highest probability of using a Navigo is found among employees (41%), managers (43.5%) and intermediate professionals (38%). The unemployed have a notable propensity to use tickets and tickets: their mobility is more irregular than that of an employee and a Navigo is not necessarily "profitable" for them. The inactive and retired have a fairly high probability (33%) of travelling with a ticket: like the unemployed, they have irregular mobility that is generally limited to a local area (and therefore limited use of the train).
Mobility behaviour (number of trips, modes taken, reasons, etc.) differs depending on the tickets used.
Distribution of passengers by number of trips per week (January 2014)
The distribution of the number of trips per week is a "bell curve" for Navigo passes, Imagine R passes and Solidarité Transport passes, but with differences.
The downward curve in the distribution of the number of trips per week for the Free Transport and Amethyst packages shows a fairly large share of people with mobility who are occasional users of public transport.
Evolution over 2013 of the number of journeys per week compared to the average number of journeys over a week of peak trafficThe distribution of journeys over the whole of a year also highlights the differences in behaviour between users of the different tickets. Imagine R mobility, quite logically, is the most sensitive to seasonality with strong contrasts between holiday periods and non-holiday periods.
Conversely, the mobility of the Free Transport and Solidarity Transport packages is less sensitive to seasonality than Navigo mobility. Two types of explanation can be put forward: on the one hand, disadvantaged groups go on holiday less; on the other hand, they use the CTs for reasons other than commuting (and therefore continue to use the CTs if they are on holiday and stay in the region).
Regarding the modes used during their trips, the practices of Navigo and Imagine R Student subscribers are quite similar, with a large proportion of trips including metro and/or train journeys. This is consistent with the structure of sales of these packages, where packages including zone 1 dominate, with a significant place for 1-2 packages: the typical model of these users is to make home-work or home-study trips, sometimes quite long, between the suburbs and Paris.
Imagine R Scolaire subscribers share with Amethyst beneficiaries a strong propensity to take the bus, which goes hand in hand with the fact that these users' journeys are shorter and local. For Imagine R Scolaire subscribers, this is consistent with a sales structure dominated by 2 suburb-suburb zone packages.
The Free Transport and Solidarity Transport packages are in intermediate configurations:
When the share of "returns home" is close to 50%, it means that travellers make few "triangular" trips (going from home to place A for one activity, then from place A to place B for another activity, then back from place B to home).
Imagine R Student and Navigo subscribers are more likely to make triangular trips, i.e. to optimize their mobility by combining various activities in the same succession of trips. Conversely, Amethyst beneficiaries and Imagine R Scolaire subscribers are more likely to make simple round trips.
The share of home-work or home-study trips is equivalent for Navigo subscribers and Imagine R Student subscribers, but the other reasons are a little more utilitarian for Navigo subscribers: purchases and formalities are more important to them, while leisure activities are more important to Imagine R Student subscribers.