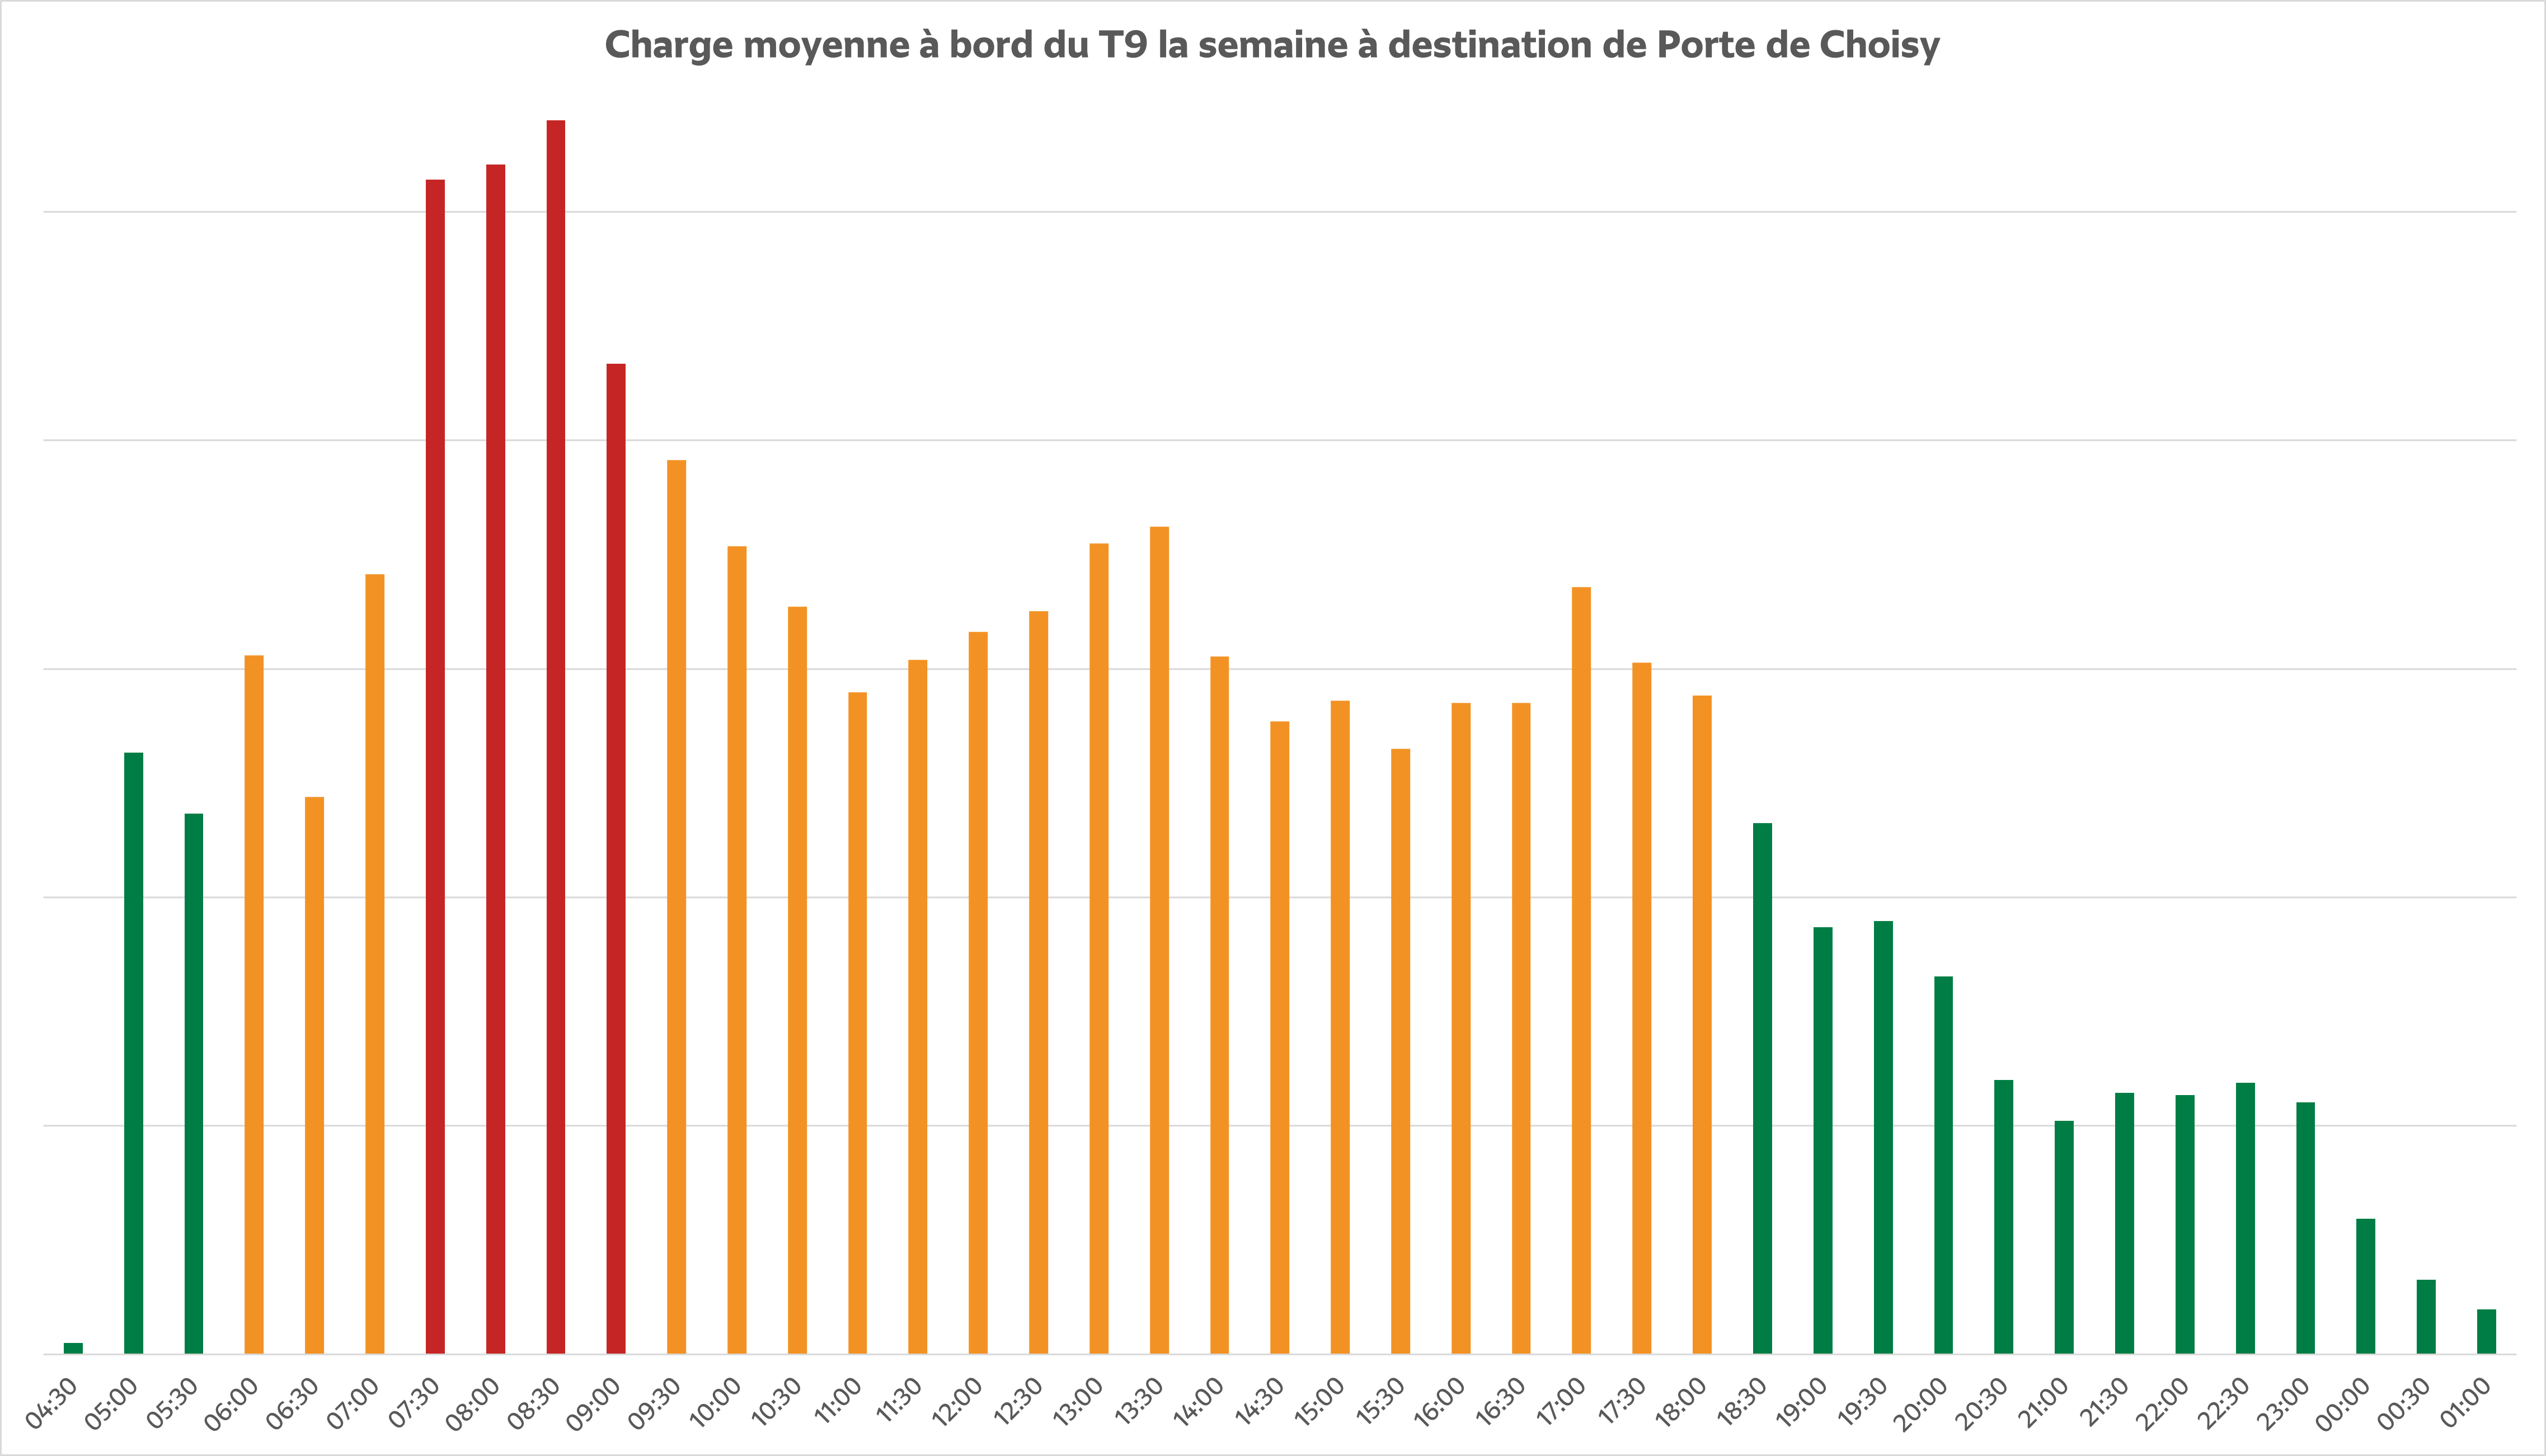
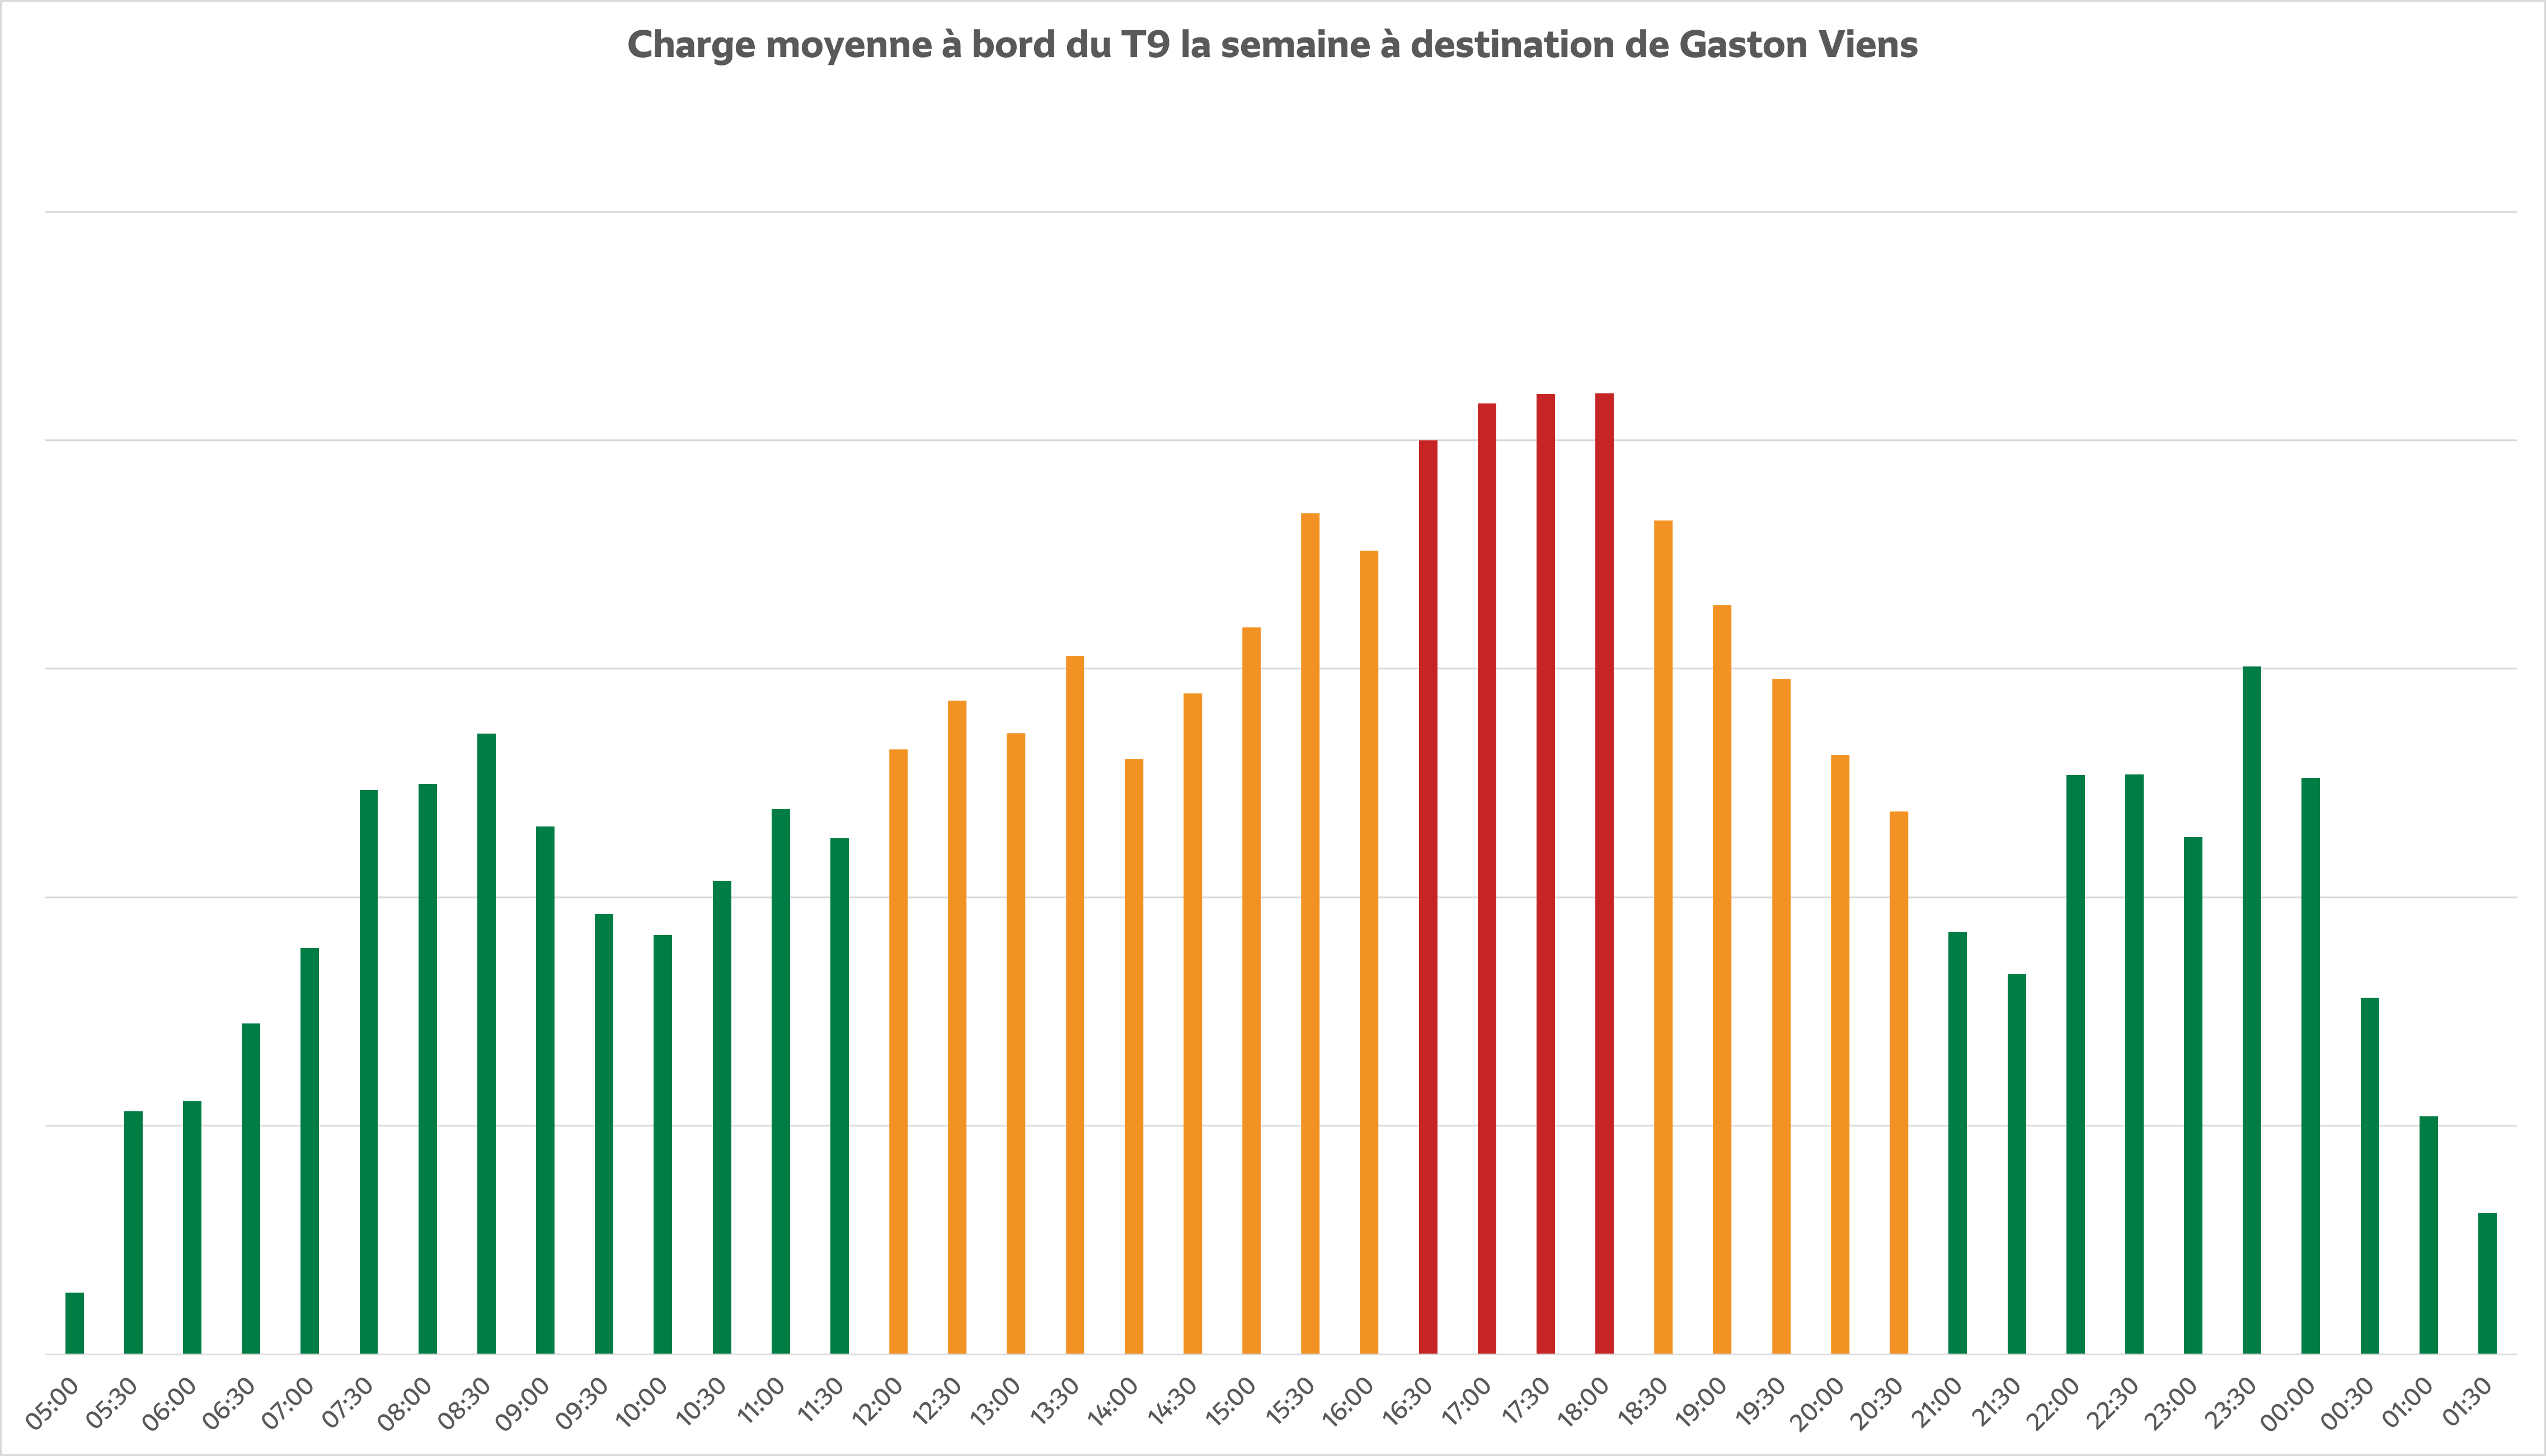
How can we understand this information?
The number of passengers on board is presented by direction of traffic, as the number of passengers varies depending on whether you are travelling to Paris or Orly at different times of the day.
Each graph presents a theoretical level of traffic on a color scale:
- Green : light tram, seating available, relaxed travel.
- Yellow : average crowds, sometimes limited seats, a few passengers standing.
- Red : high influx, tram often full, passengers standing and sometimes waiting.
These visuals will help you anticipate your journey according to your usual or occasional schedule, choosing the time slot that best suits your needs. However, this information remains a theoretical average for the entire race. The actual attendance on a given day may be different from the average attendance usually observed.