User perception is a central indicator for Île-de-France Mobilités. In addition to technical measures, we closely monitor the experience of transport, in order to enrich our knowledge of the service provided and guide improvement actions.
We pay particular attention to the daily experience of transport, which is an essential reflection of the quality of public service.
In 2025, 66,861 regular passengers were interviewed by RATP face-to-face (on platforms, stations and stops) to share their vision of the Ile-de-France network.
Discover the result of the survey.
Lines operated by RATP: survey on the quality of service
The annual satisfaction score for the lines operated by RATP received by regularpassengers is 88%.
Perception of the quality of service on the lines operated by RATP
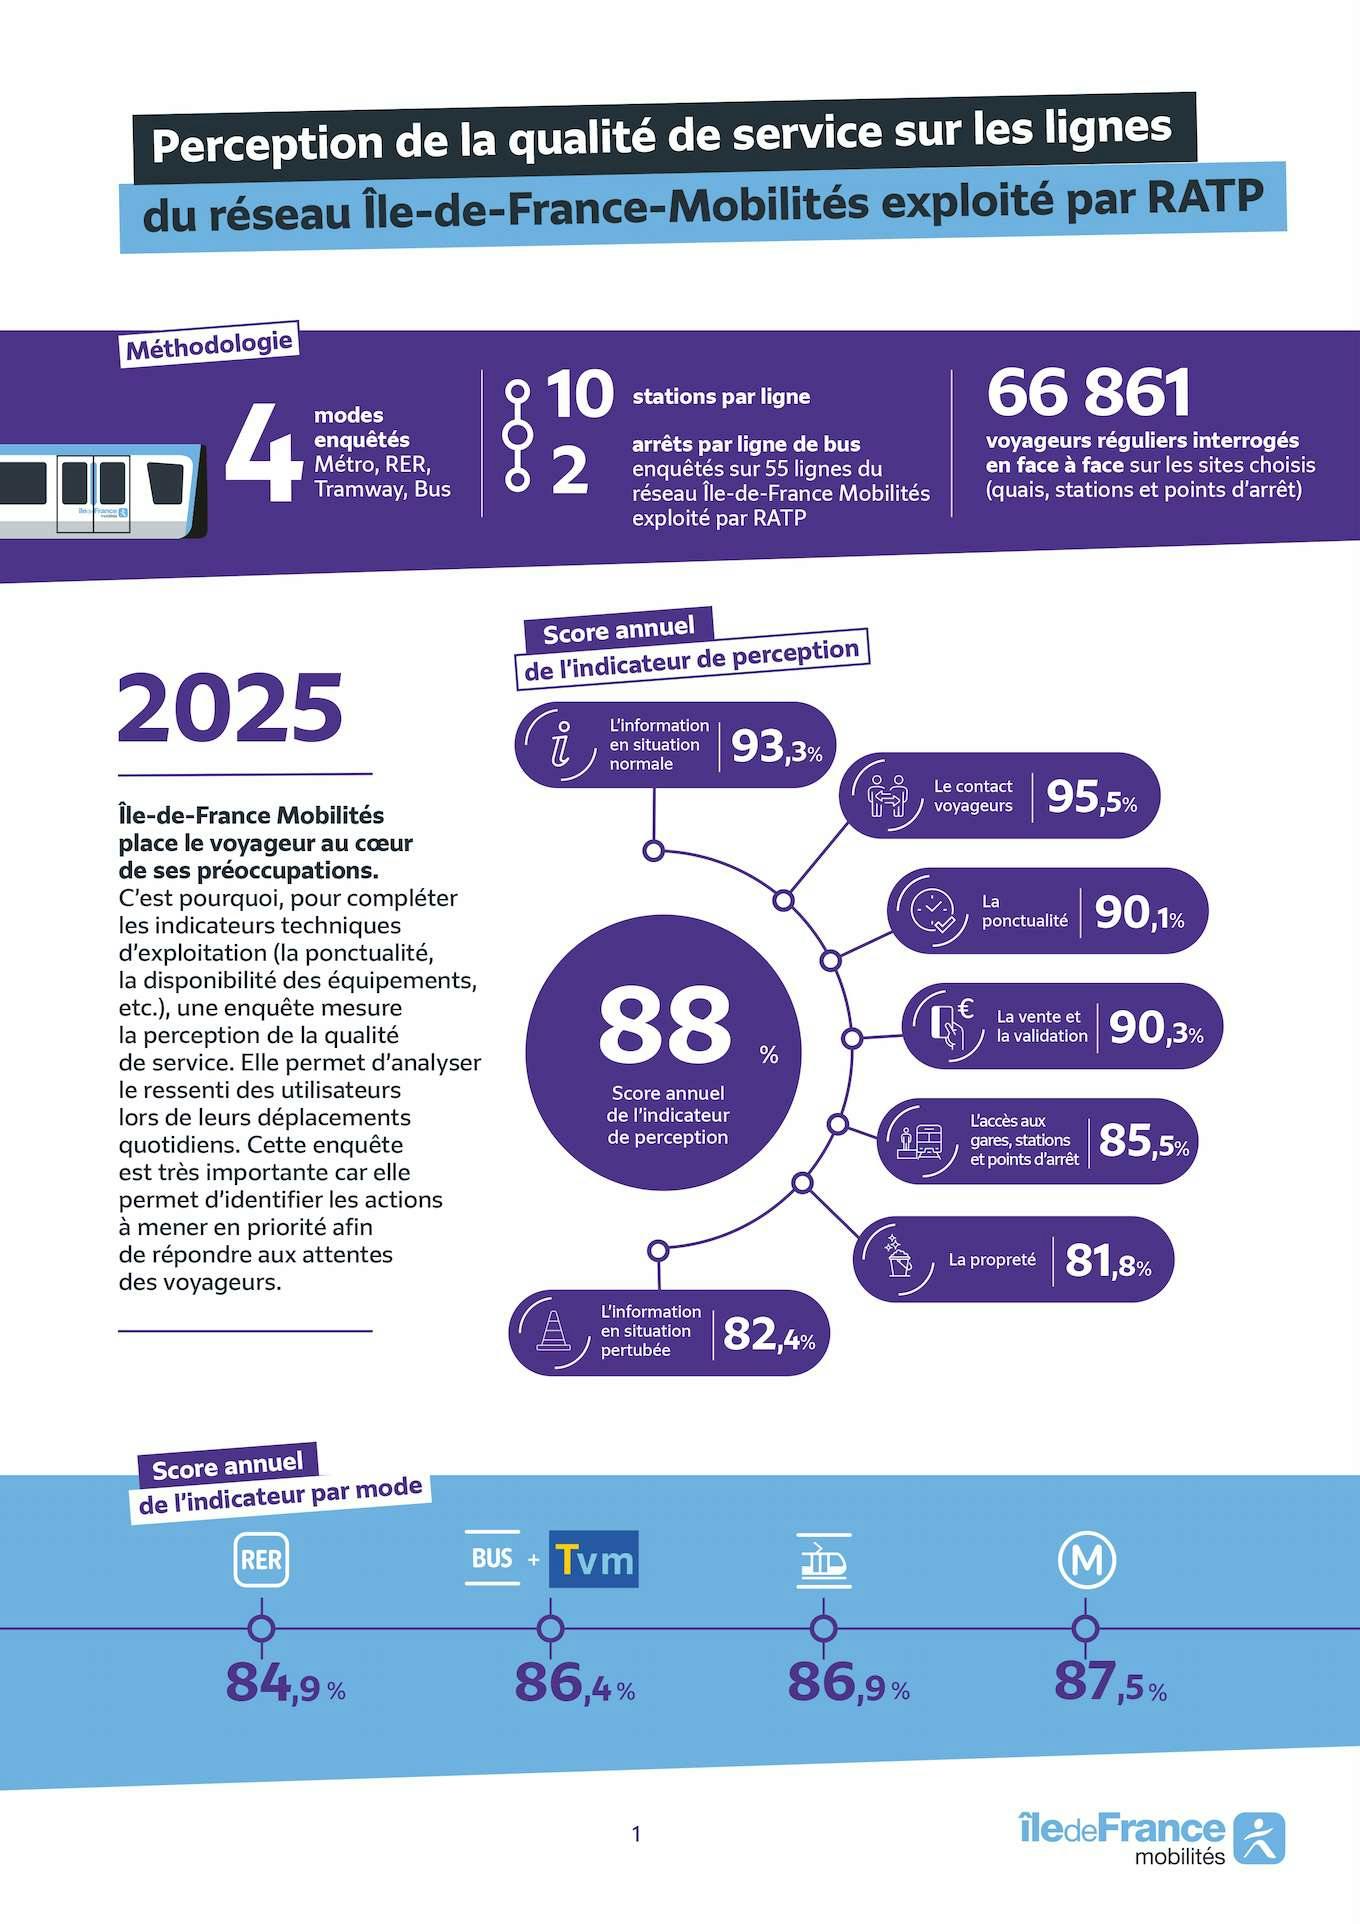
Methodology:
- 4 modes surveyed: metro, RER, tram, bus
- 10 stations per line
- 2 stops per bus line surveyed out of 55 lines operated by RATP
- 66,861 regular customers interviewed face-to-face at the chosen sites (platforms, stations and stopping points)
2025
Île-de-France Mobilités places the passenger at the heart of its concerns. This is why, in addition to the technical operating indicators (punctuality, availability of equipment, etc.), a survey measures the perception of the quality of service. It makes it possible to analyse the feelings of users during their daily journeys. This survey is very important, because it allows us to identify the actions to be taken as a priority in order to meet the expectations of passengers.
Semi-annual perception indicator score: 88%
Details of the scores by criterion:
- Information in normal situations: 93.3%
- Passenger contact: 95.5%
- Punctuality: 90.1%
- Sales and validation: 90.3%
- Access to stations, stations and stops: 85.5%
- Cleanliness: 81.8%
- Information in a disrupted situation: 82.4%
Annual indicator score by mode of transport:
- RER: 84.9%
- Bus + TVM: 86.4%
- Tramway: 86.9%
- Metro: 87.5%
Source: Île-de-France Mobilités
And in the metro, what do regular passengers think of their journey?
In 2025, metro line 14, which is 100% automatic, will have the best score with 92.6% passenger satisfaction.
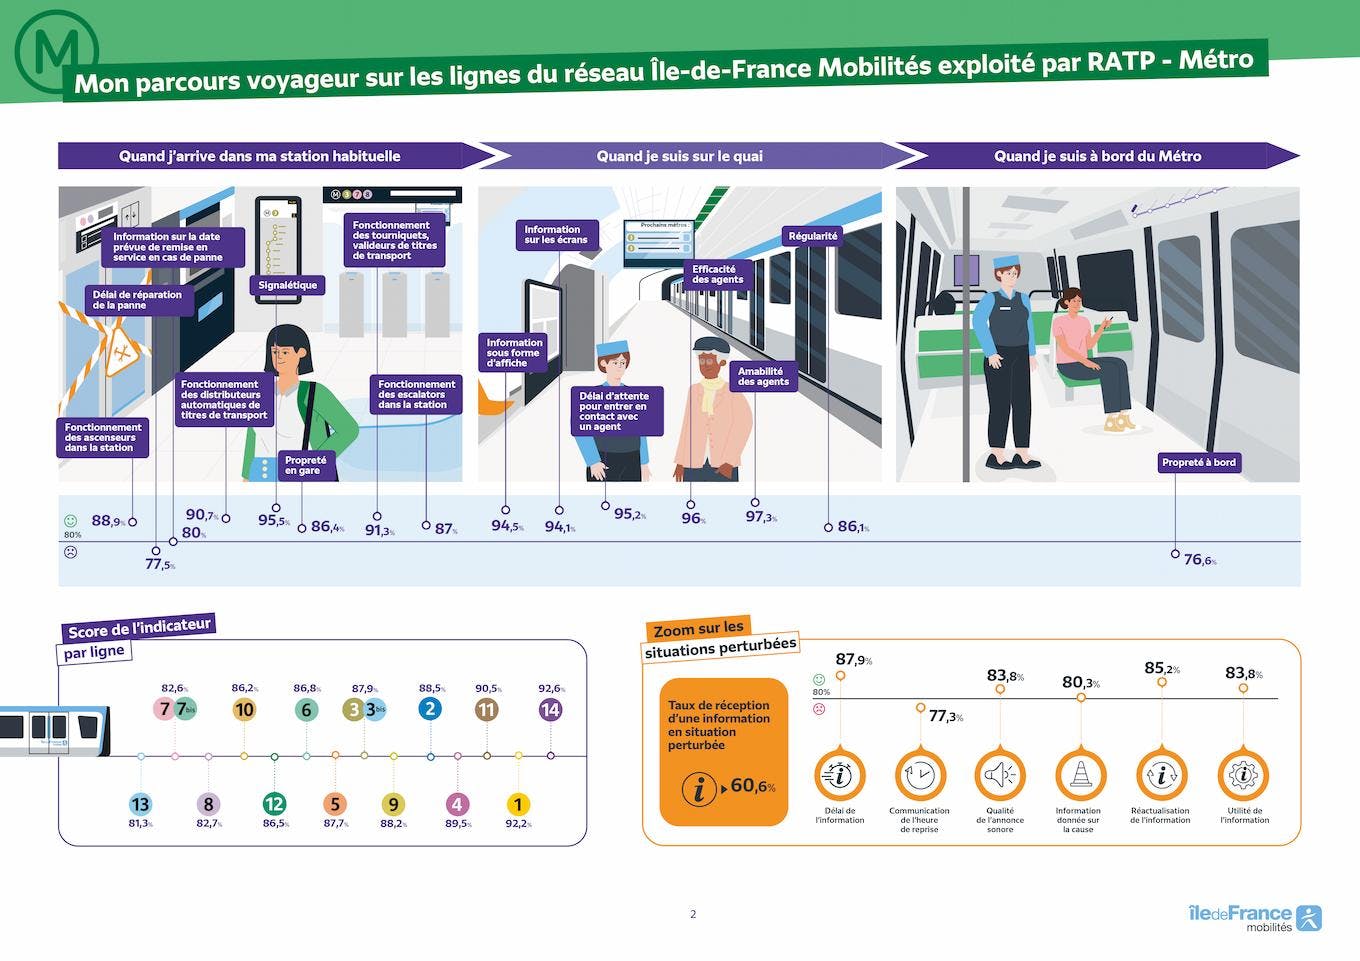
My customer journey on the lines operated by RATP – Metro
This infographic describes the customer experience in the metro, divided into three stages: arrival at the station, waiting on the platform and journey on board. Illustrations accompany the data.
When I arrive at my usual station:
- Information on the expected date of return to service in the event of a breakdown : 80% satisfaction.
- Breakdown repair time : 77.5% satisfaction.
- Operation of the lifts in the station : 90.7% satisfaction.
- Operation of transport tickets vending machines : 90.4% satisfaction.
- Signage : 95.5% satisfaction.
- Operation of turnstiles, transport tickets validators : 91.3% satisfaction.
- Operation of the escalators in the resort : 87% satisfaction.
- Cleanliness at the station : 86.4% satisfaction.
When I'm on the dock:
- Information on screens : 94.1% satisfaction.
- Information in the form of a poster : 94.5% satisfaction.
- Wait time to get in touch with an agent : 95.2% satisfaction.
- Agent efficiency : 96% satisfaction.
- Friendliness of the agents : 97.3% satisfaction.
- Regularity : 86.1% satisfaction.
When I'm on board the metro:
- Cleanliness on board : 76.6% satisfaction.
Indicator score per line:
- Line 1: 92.2%
- Line 2: 88.5%
- Line 3: 87.9%
- Line 3bis: 87.9%
- Line 4: 89.5%
- Line 5: 87.7%
- Line 6: 86.8%
- Line 7: 82.6%
- Line 7bis: 82.6%
- Line 8: 82.7%
- Line 9: 88.2%
- Line 10: 86.2%
- Line 11: 90.5%
- Line 12: 86.5%
- Line 13: 81.3%
- Line 14: 92.6%
Focus on the disrupted situations:
- Rate of receiving information in a disturbed situation : 62.2%
Among those who received information:
- Deadline for information : 87.9% satisfaction.
- Communication of the time of resumption : 77.3% satisfaction.
- Quality of the audio announcement : 83.8% satisfaction.
- Information given on the cause : 80.3% satisfaction.
- Up-to-date information : 85.2% satisfaction.
- Usefulness of the information : 83.8% satisfaction.
Source: Île-de-France Mobilités.
The scores indicate the share of travelers who say they are satisfied or very satisfied.
And on the bus and TVM lines?
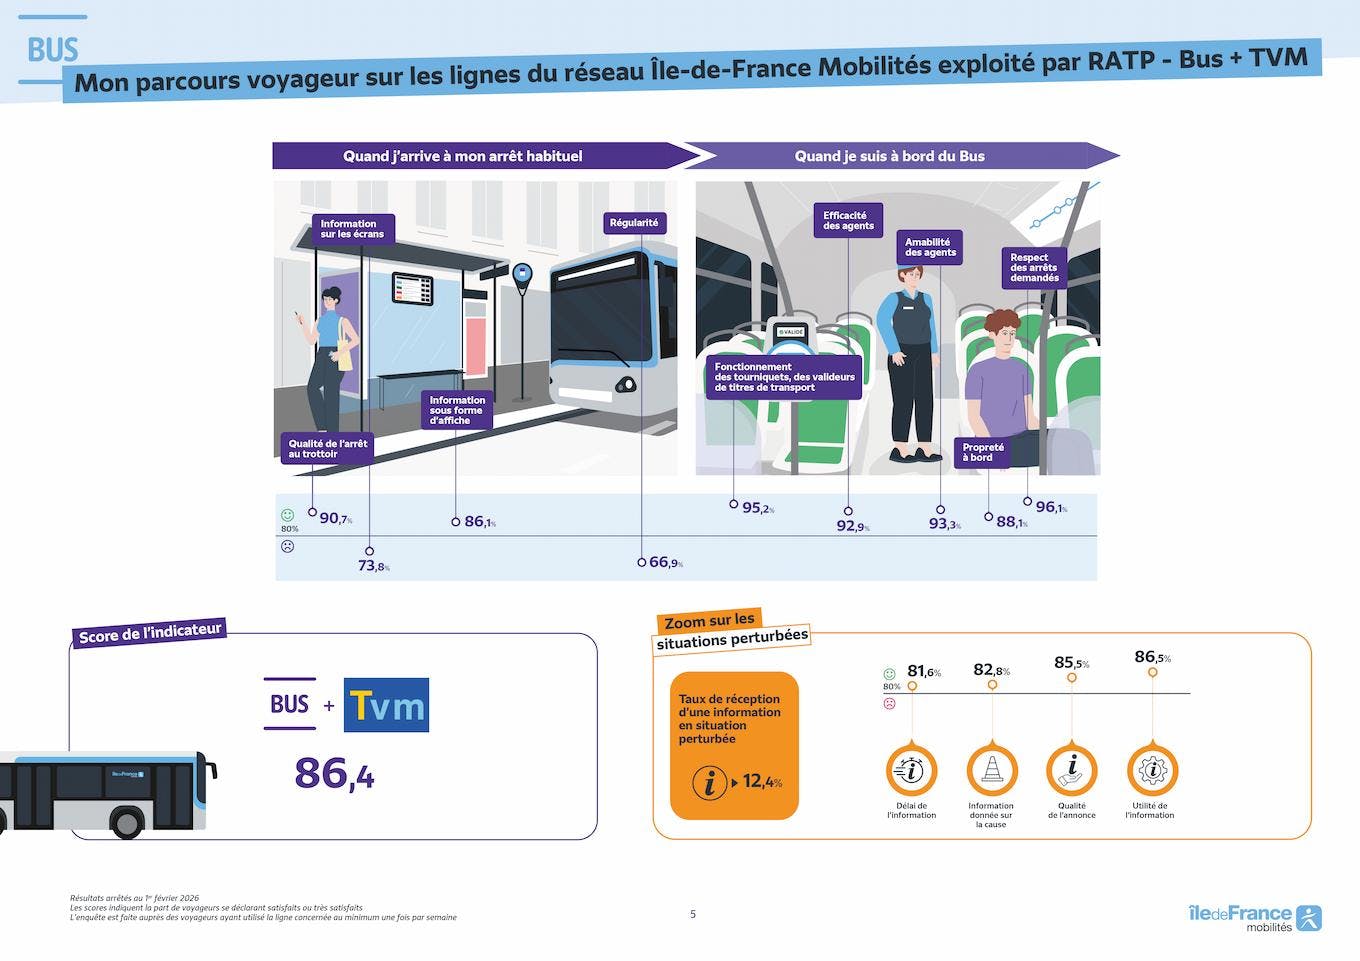
My customer journey on the lines operated by RATP – Bus + TVM
This infographic describes the customer experience on buses and TVM (Trans-Val-de-Marne), divided into two stages: at the bus stop and on board the bus. Illustrations accompany the data.
When I arrive at my usual stop:
- Quality of the stop at the curb : 90.7% satisfaction.
- Information on screens : 73.8% satisfaction.
- Information in the form of a poster : 86.1% satisfaction.
- Regularity : 66.9% satisfaction.
When I'm on the bus:
- Operation of turnstiles, transport tickets validators : 95.2% satisfaction.
- Agent efficiency : 92.9% satisfaction.
- Friendliness of the agents : 93.3% satisfaction.
- Cleanliness on board : 88.1% satisfaction.
- Compliance with the requested stops : 96.1% satisfaction.
Overall satisfaction score:
- BUS + TVM indicator score : 86.4% satisfaction.
Focus on the disrupted situations:
- Rate of receiving information in a disturbed situation : 12.4%.
Of those who received information:
- Delay of the information : 81.6% satisfaction.
- Information given on the cause : 82.8% satisfaction.
- Quality of the ad : 85.5% satisfaction.
- Usefulness of the information : 86.5% satisfaction.
Source: Île-de-France Mobilités.
The scores indicate the share of travelers who say they are satisfied or very satisfied.
On the tram lines
Once again, it is the T6 line that comes in first place with 91.4% satisfaction.
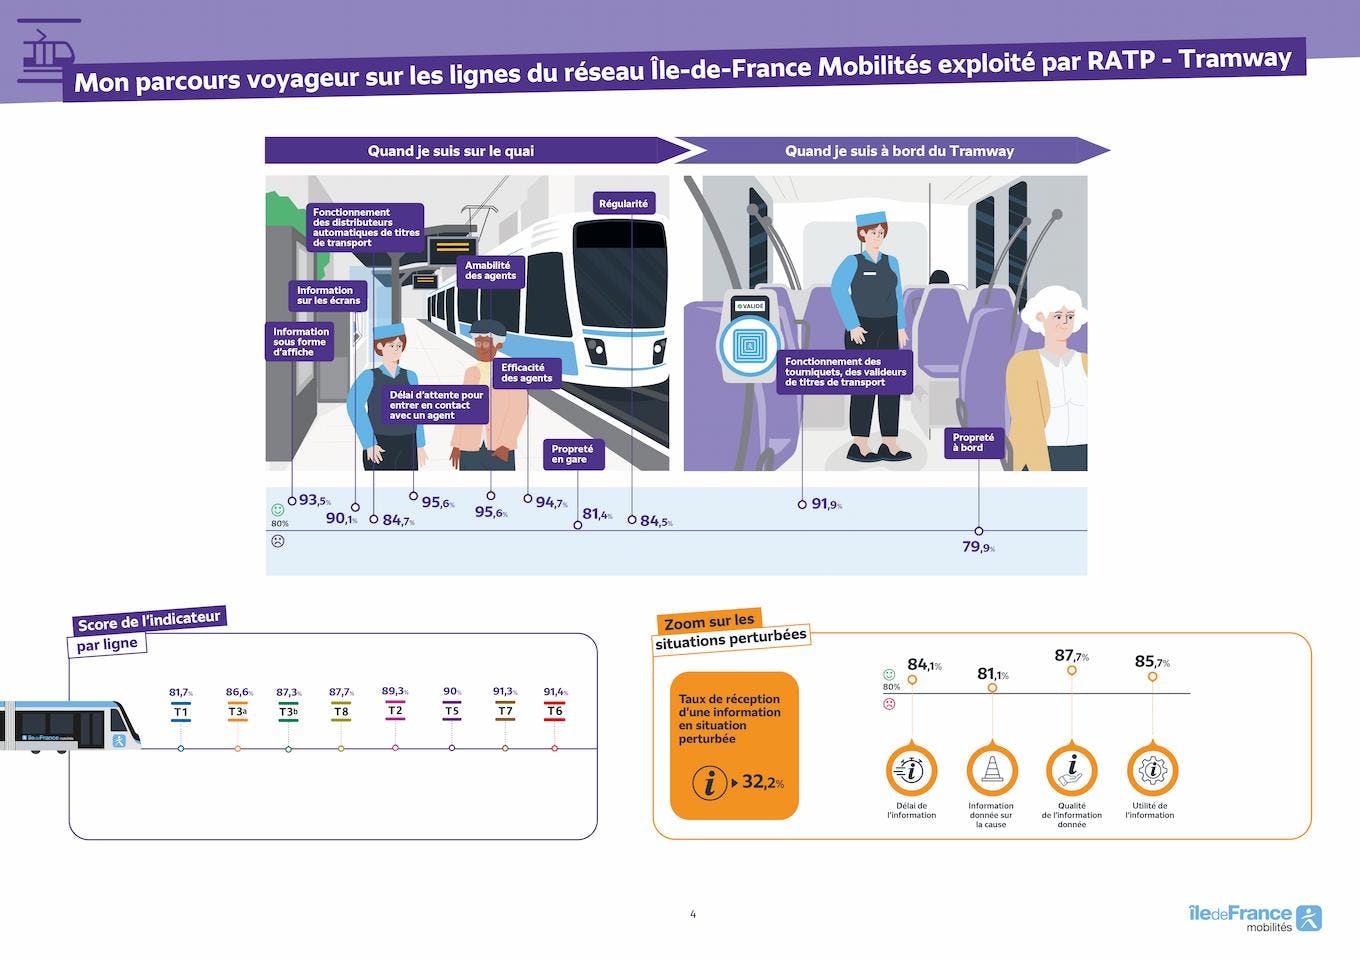
My customer journey on the lines operated by RATP - tramway
This infographic illustrates the customer experience on tram lines, in two stages: waiting on the platform and the journey on board. Visual illustrations accompany the data.
When I'm on the dock:
- Information on screens: 90.1% satisfaction. Illustration of a display screen.
- Operation of transport tickets vending machines: 84.7% satisfaction.
- Information in the form of a poster: 93.5% satisfaction.
- Wait time to get in touch with an agent: 95.6% satisfaction.
- Friendliness of agents: 95.6% satisfaction.
- Agent efficiency: 94.1% satisfaction.
- Cleanliness in the station: 81.4% satisfaction.
- Regularity: 84.5% satisfaction.
When I'm on board the tram:
- Operation of turnstiles, transport tickets validators: 91.9% satisfaction.
- Cleanliness on board: 79.9% satisfaction.
Indicator score per line:
- Q1: 81.7%
- Q2 : 89.3%
- Q3a: 86.6%
- Q3b: 87.3%
- Q5: 90%
- Q6: 91.4%
- Q7: 91.3%
- Q8: 87.7%
Focus on the disrupted situations:
- Rate of receipt of information in a disturbed situation: 32.2%
- Delay of the information: 84.1% satisfaction.
- Information given on the cause: 81.1% satisfaction.
- Quality of the information given: 87.7% satisfaction.
- Usefulness of the information: 85.7% satisfaction.
Source: Île-de-France Mobilités.
The scores indicate the share of travelers who say they are satisfied or very satisfied.
And on the RER lines operated by RATP?
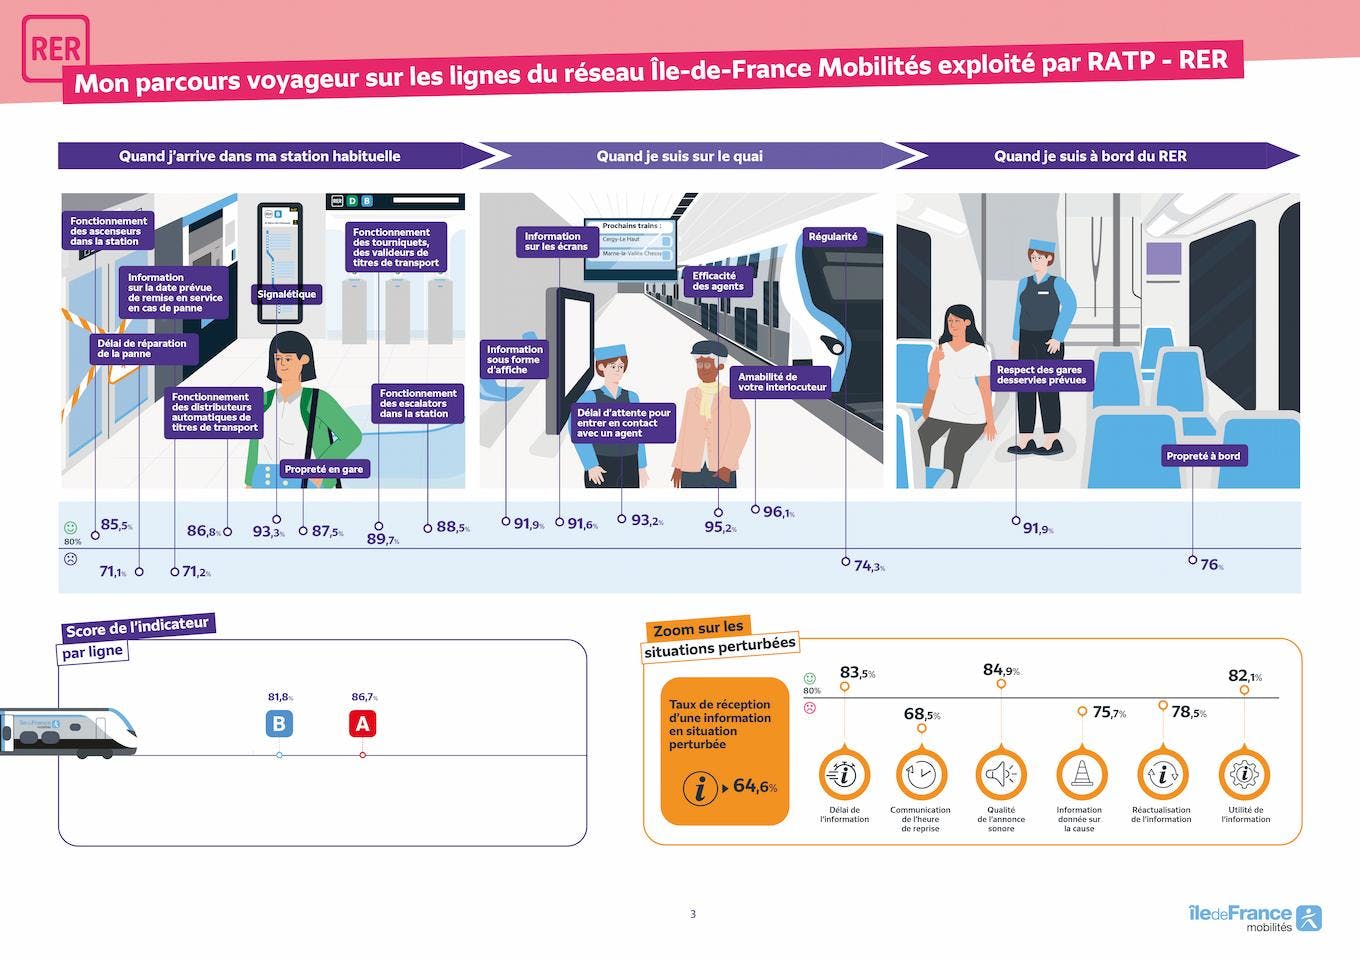
My customer journey on the lines operated by RATP - RER
This infographic describes the customer experience on RER lines, broken down into three stages: arrival at the station, waiting on the platform and journey on board. Illustrations accompany the data.
When I arrive at my usual station:
- Operation of the lifts in the station: 85.5% satisfaction.
- Information on the expected date of return to service in the event of a breakdown: 71.2% satisfaction.
- Breakdown repair time: 71.1% satisfaction.
- Signage: 93.3% satisfaction.
- Operation of turnstiles, transport tickets validators: 89.3% satisfaction.
- Operation of transport tickets vending machines: 86.8% satisfaction.
- Operation of the escalators in the resort: 88.5% satisfaction.
- Cleanliness at the station: 87.5% satisfaction.
When I'm on the dock:
- Information on screens: 91.6% satisfaction.
- Information in the form of a poster: 91.9% satisfaction.
- Wait time to get in touch with an agent: 93.2% satisfaction.
- Agent efficiency: 95.2% satisfaction.
- Friendliness of your interlocutor: 96.1% satisfaction.
- Regularity: 74.3% satisfaction.
When I am on board the RER:
- Compliance with the planned stations served: 91.9% satisfaction.
- Cleanliness on board: 76% satisfaction.
Indicator score per line:
- Line A: 86.7%
- Line B: 81.8%
Focus on the disrupted situations:
- Rate of receiving information in a disrupted situation: 64.1%
- Deadline for information: 83.5% satisfaction.
- Communication of the time of resumption: 68.5% satisfaction.
- Quality of the audio announcement: 84.9% satisfaction.
- Information given on the cause: 75.7% satisfaction.
- Updating of information: 78.5% satisfaction.
- Usefulness of the information: 82.1% satisfaction.
Source: Île-de-France Mobilités.
The scores indicate the share of travelers who say they are satisfied or very satisfied.
Lines operated by SNCF: survey on the quality of service
The half-yearly satisfaction score for the lines operated by SNCF received by the regular passengers surveyed is 79.9% for the year 2025.
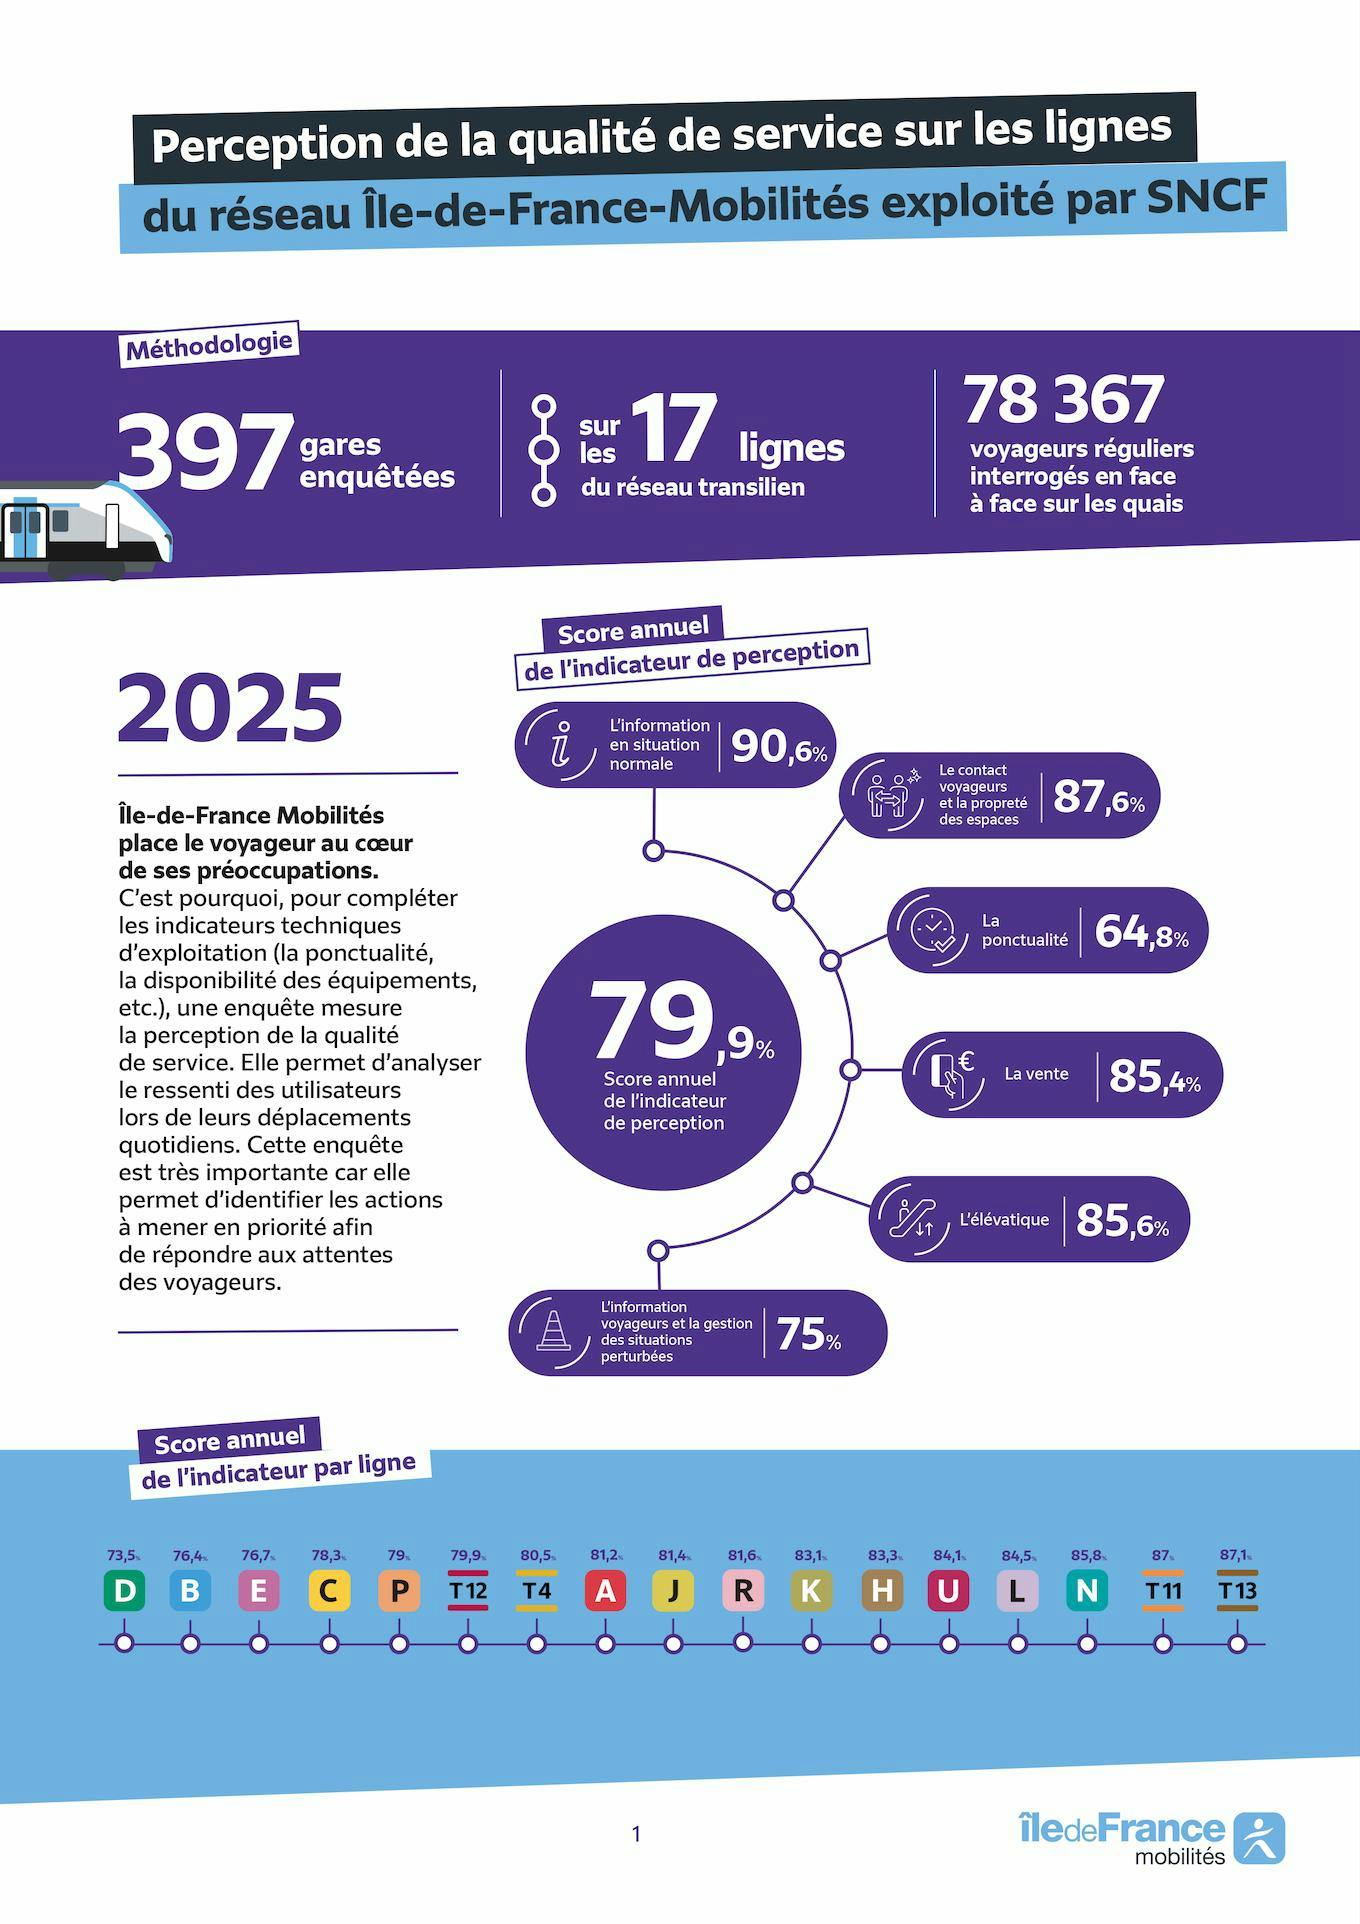
Perception of the quality of service on the lines operated by SNCF
Methodology:
- 397 stations surveyed
- On the 16 lines of the Transilien lines
- 40,879 regular customers surveyed face-to-face on the docks
2025
Île-de-France Mobilités places the passenger at the heart of its concerns. This is why, in addition to the technical operating indicators (punctuality, availability of equipment, etc.), a survey measures the perception of the quality of service. It makes it possible to analyse the feelings of users during their daily journeys. This survey is very important because it allows us to identify the actions to be taken as a priority in order to meet the expectations of passengers.
Annual Perception Indicator Score: 79.9%
Details of the scores by criterion:
- Information in normal situations: 90.6%
- Passenger contact and cleanliness of spaces: 87.6%
- Punctuality: 64.8%
- Sales: 85.4%
- L'élévatique (Elevators/Escalators): 85.6%
- Passenger information and management of disrupted situations: 75%
Annual indicator score per line:
- Line D: 73.5%
- Line E: 76.7%
- Line B: 76.4%
- Line C: 78.3%
- Line P: 79%
- Line T4: 80.5%
- T12 line: 79.9%
- Line A: 81.2%
- Line J: 81.4%
- R line: 81.6%
- Line H: 83.3%
- U-line: 84.1%
- Line L: 84.5%
- Line N: 85.8%
- Line K: 83.1%
- T13 line: 87.1%
- Line T11: 87%
Source: Île-de-France Mobilités
Passenger vision on the lines operated by SNCF: what do regular passengers think of their journey?
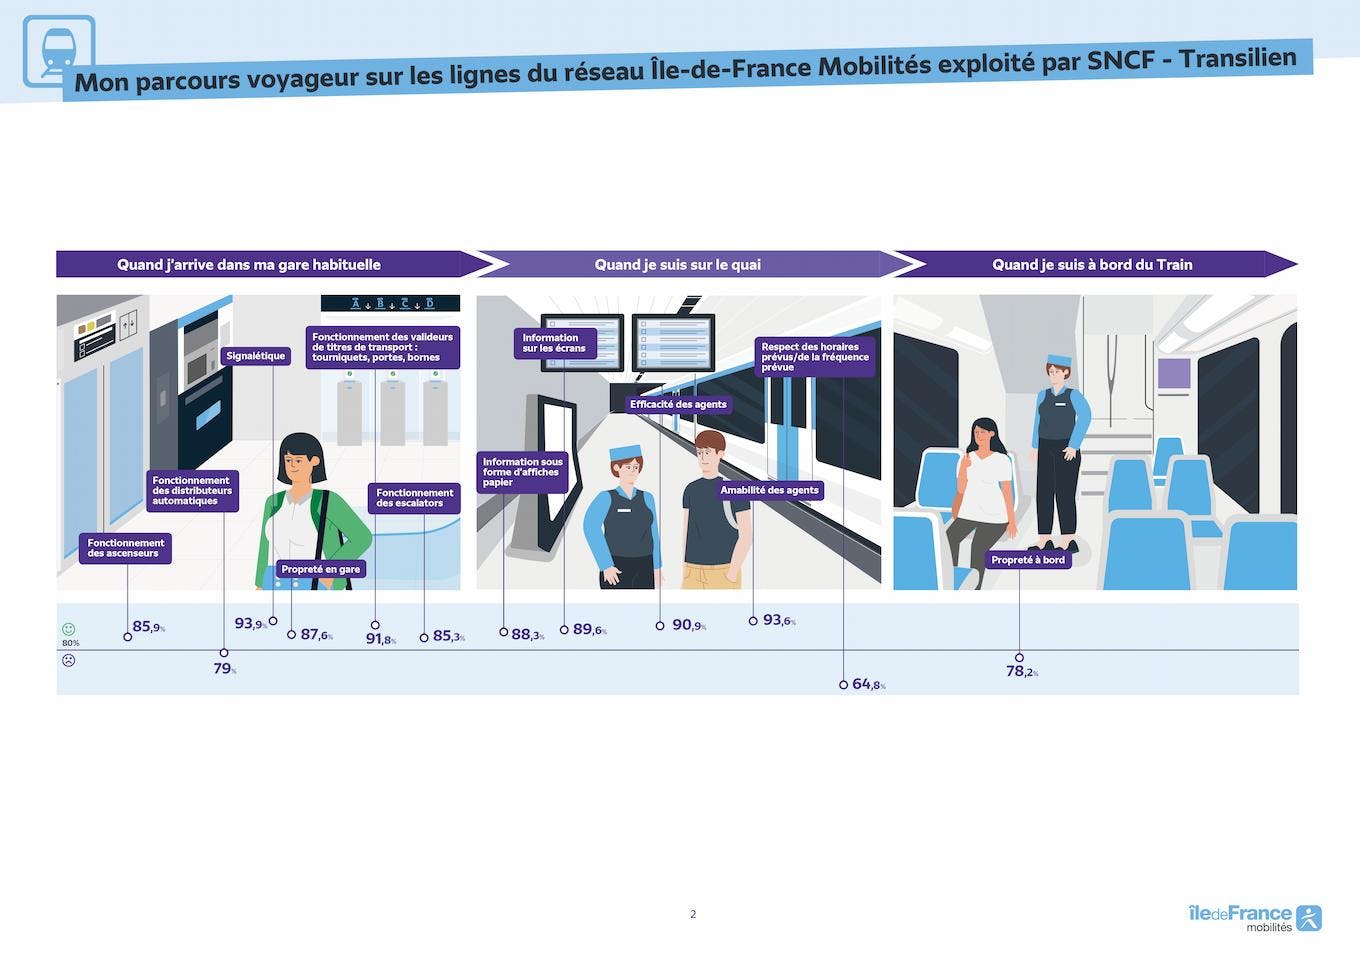
My customer journey on the lines operated by SNCF - Transilien
This infographic describes the customer experience on the Transilien lines operated by the SNCF, divided into three stages: arrival at the station, waiting on the platform and journey on board the train. Illustrations accompany the data.
When I arrive at my usual station:
- Elevator operation: 85.9% satisfaction.
- Signage: 93.9% satisfaction.
- Operation of transport tickets validators: turnstiles, gates, terminals: 91.8% satisfaction.
- Vending machine operation: 79% satisfaction.
- Operation of the escalators: 85.3% satisfaction.
- Cleanliness at the station: 87.6% satisfaction.
When I'm on the dock:
- Information on screens: 89.6% satisfaction. Illustration of display screens.
- Information in the form of paper posters: 88.3% satisfaction.
- Agent efficiency: 90.9% satisfaction.
- Friendliness of the agents: 93.6% satisfaction.
- Compliance with scheduled schedules/frequency: 64.8% satisfaction.
When I'm on the train:
- Cleanliness on board: 78.2% satisfaction.
Source: Île-de-France Mobilités
In situations of disrupted traffic, what is the opinion of regular travellers?
And what do Ile-de-France passengers who have experienced a disrupted situation in transport in the last two days on the lines operated by SNCF think?
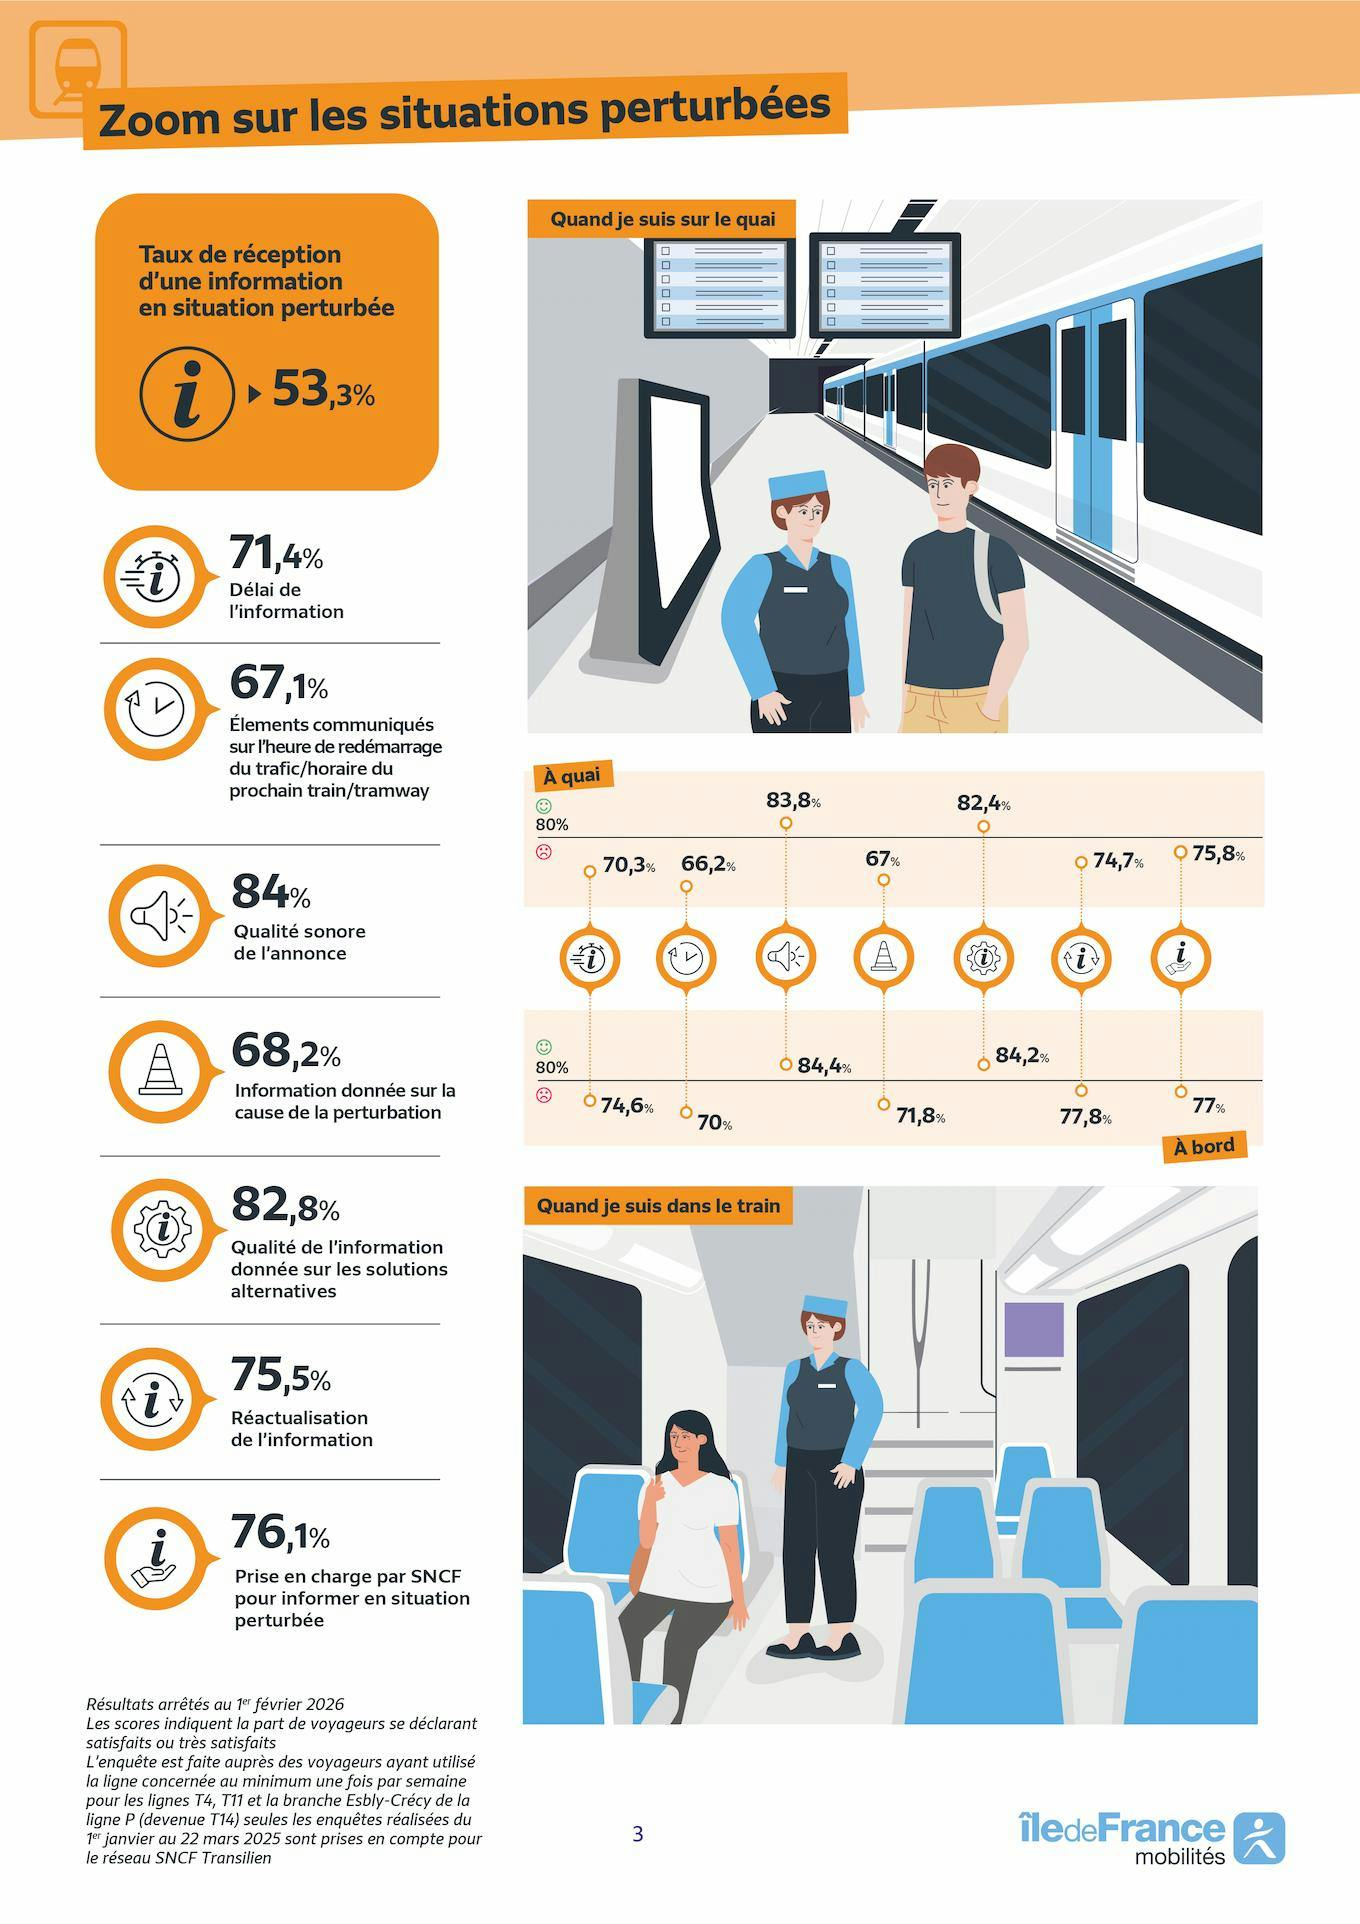
Focus on disrupted situations (lines operated by SNCF - Transilien)
This infographic details passenger information and communication during disrupted situations on the Transilien lines operated by SNCF. It is divided into two parts: on the platform and on the train.
Rate of receiving information in a disrupted situation: 53.3%
When I'm on the dock:
- Delay of the information: 71.4% satisfaction.
- Elements communicated on the time of restart of traffic/timetable of the next train/tram: 67.1% satisfaction.
- Sound quality of the ad: 84% satisfaction.
- Information given on the cause of the disruption: 68.2% satisfaction.
- Quality of the information provided on alternative solutions: 82.8% satisfaction.
- Updating of information: 75.5% satisfaction.
- SNCF support for providing information in a disrupted situation: 76.1% satisfaction.
At the quay (details of the scores by criterion in a disturbed situation): Illustration of icons representing each criterion.
- Time to Inform: 70.3%
- Restart time/next train: 66.2%
- Sound quality: 83.8%
- Cause Information: 67%
- Alternatives: 82.4%
- Up-to-date information: 74.7%
- SNCF coverage: 75.8%
On board (details of the scores by criterion in a disturbed situation):
- Time to Inform: 74.6%
- Restart time/next train: 70%
- Sound quality: 84.4%
- Cause Information: 71.8%
- Alternatives: 84.2%
- Discount: 77.8%
- SNCF coverage: 77%
Source: Île-de-France Mobilités - Results as of February 2026.
The scores indicate the share of travelers who say they are satisfied or very satisfied. The survey is carried out among passengers who have used the line concerned at least once a week for lines T4, T11 and the Esbly-Crécy branch of line P (now T14) only surveys carried out from January 1 to March 22, 2025 are taken into account for the SNCF Transilien network.
Throughout the year, Île-de-France Mobilités conducts more than 145,000 surveys on the lines operated by SNCF and RATP, to question passenger satisfaction and improve the public transport network.